Notes for the Week of Jan. 15, 2024
ECB cautious about rate cuts | The case for small caps | Reviewing CES 2024 | Air freight rates | China deflation streak | Shrinking German econ.
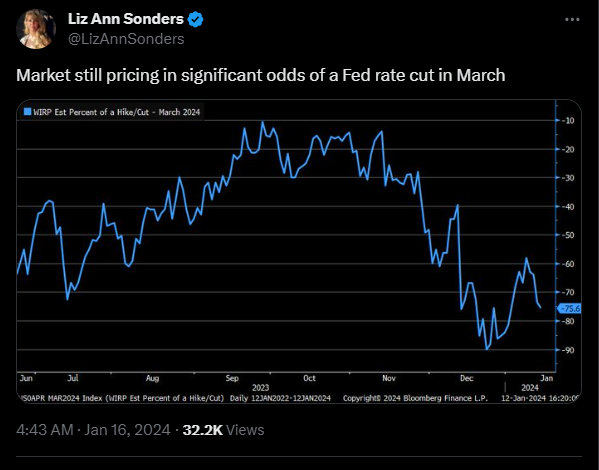
1. European Central Bank President Lagarde has added to the cautious sentiment about potential rate cuts in the near term. In an interview at Bloomberg House in Davos with Francine Lacqua, she aligned with the views of other central bankers, suggesting that rate cuts could start this summer. Her remarks come in the context of several policymakers indicating a similar timeline for such a move, leading to questions about whether there is majority support for this decision. The recent volatility in stocks and bonds is a function of resetting expectations of an earlier rate cut by the Federal Reserve. According to Liz Ann Sonders, the market is still pricing in significant odds of a Fed rate cut in March. Our base-case of the first rate cut by the Fed is June 2024. Click onto picture below to access video. REF: Bloomberg
2. Small Cap Companies have been volatile starting the year with the Russell 2000 ETF (IWM) trading down -4.92%. However, there are several compelling arguments to be made for considering small-cap stocks in 2024. REF: UBS
- Higher Growth Potential – Small-cap companies are often in earlier stages of growth compared to their large-cap counterparts. This can translate to outsized revenue and earnings growth compared to the broader market, as they haven't yet reached full market saturation. They tend to be nimbler and more adaptable to changing market conditions and consumer preferences, allowing them to seize new opportunities quicker and capitalize on emerging trends…
- Attractive Valuations – Relative to larger companies, small-caps are currently trading at a discount. This means you can potentially access higher future growth at a lower entry point. The Russell 2000 index, a benchmark for small-cap stocks, currently trades at a forward price-to-earnings (P/E) ratio of around 13.6, significantly lower than the S&P 500's P/E of 21.8. This suggests that small-caps offer better value for money…
- Potential Reshoring Trend – Rising geopolitical tensions and supply chain disruptions are prompting some companies to consider reshoring manufacturing back to the US. This could benefit small-cap companies heavily involved in domestic production and reduce their exposure to external risks…
- Benefiting from Lower Rates – Nearly half of the debt held by Russell 2000 companies is floating rate compared to a tenth for large-cap companies. Therefore, when the Federal Reserve starts to cut interest rates, small companies will experience a lowered interest expense. In addition, Small-cap companies are generally less reliant on debt financing compared to larger corporations. This makes them less susceptible to rising interest rates, which can negatively impact companies with high debt levels.
With the current macro-economic backdrop, below are areas we currently favor:
- Fixed Income – Short-term (Low-Beta)
- Fixed Income – Adding Duration & High Yield as Opportunistic Allocation (Low-Beta) – See chart of iShares 20+ year Treasury Bond ETF (TLT) below.
- Mid Cap Stocks & Small Cap Stocks (Market-Risk)
- Industrials (Market-Risk)
- Businesses that will benefit from AI and Automation (Market-Risk)
- Healthcare & Biotechnology (Market-Risk)
- Uranium / Copper / Gold (Market-Risk)
- Clean Energy / Solar / Nuclear (Market-Risk)
3. The Consumer Electronics Show, or CES 2024, took place from January 9th to 12th in Las Vegas. At CES 2024, a range of prominent themes and categories took center stage, reflecting the dynamic nature and ongoing innovations in technology. Key areas of focus included but not limited to:
- Generative AI: A highlight of the event, generative AI was showcased for its diverse applications across multiple sectors, including healthcare. Discussions centered around its role in driving innovation and considerations surrounding privacy and security.
- Automotive Technology: The automotive sector at CES continued to expand, presenting the newest developments in vehicle technology, advanced mobility solutions, and a variety of new transportation forms. This included advancements in self-driving and electric vehicles, as well as innovative car audio and entertainment systems.
- Hearables and Audio: The domain of audio technology, encompassing smart speakers, Bluetooth speakers, and sophisticated home theatre systems, maintained its significance at the event. Notably, advancements in hearables, especially wireless earbuds designed for individuals with hearing challenges, were a key highlight.
- Smart Glasses: Gaining momentum, this category featured products like the Apple Vision Pro and Meta Ray-Ban smart glasses. These devices offered functionalities ranging from audio output and memory capture to accessing virtual environments and real-time language translation.
- High-Tech Laptops: Showcasing the latest from major hardware and software brands, the laptop segment featured AI-enhanced innovations. This extended to peripheral technologies such as wireless mice, keyboards, and gaming headsets.
These themes at CES 2024 not only underscored the ongoing evolution and influence of technology but also offered insights into the future directions of various industries and consumer products. Click onto pictures below to access videos. REF: CES2024, TechXplore, WhatsYourTech, TWICE
4. World Watch
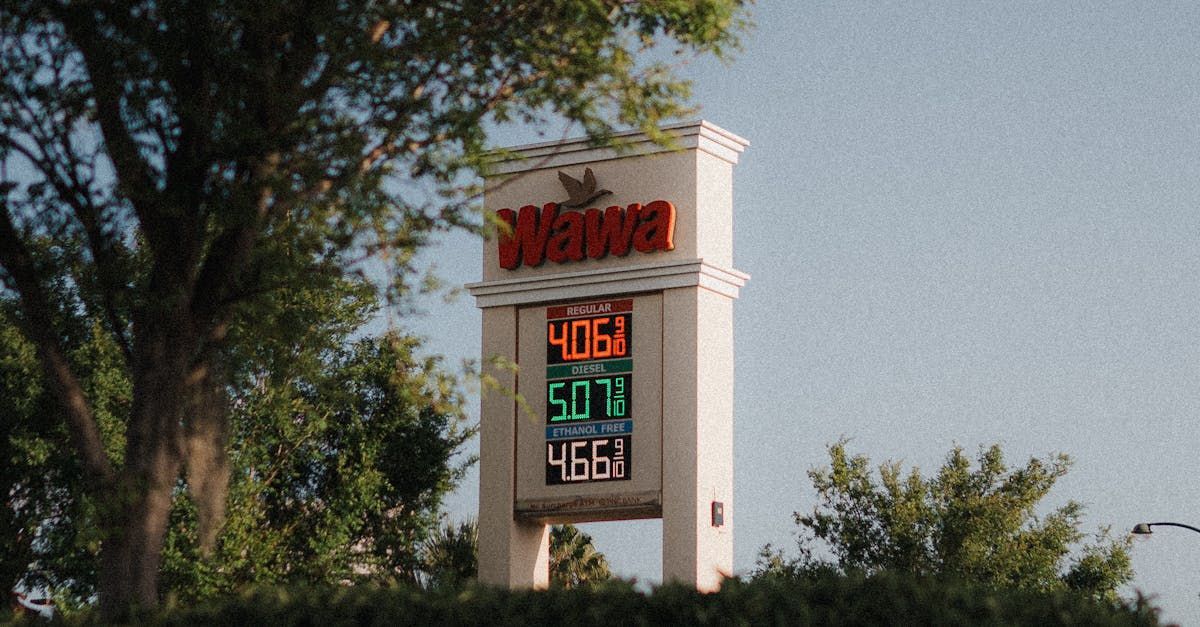
4a. Air freight rates could spike as Red Sea attacks disrupt shipments via sea according to CNBC. The growing disruptions in global trade flows, particularly in maritime trade, may compel retailers to opt for air freight as an alternative. This shift is primarily due to companies that typically rely on sea shipping now seeking quicker delivery options. Air freight offers a significant reduction in delivery times, cutting down transit from several weeks, as is common with ocean carriers, to just a few days. Recent geopolitical tensions have led to a significant increase in shipping costs. In just the past six weeks, there has been an approximate 120% rise in global freight rates. This spike is largely attributed to the recent attacks on commercial vessels in the Red Sea. Comparatively, this rate of increase is notable but still less than the 168% surge experienced during the pandemic. These geopolitical factors are not only escalating shipping costs but also continuing to exert upward pressure on commodity prices and causing disruptions in supply chains. REF: CNBC, TheKobeissiLetter

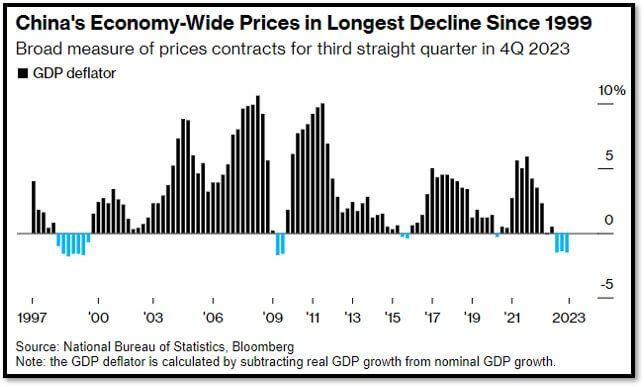
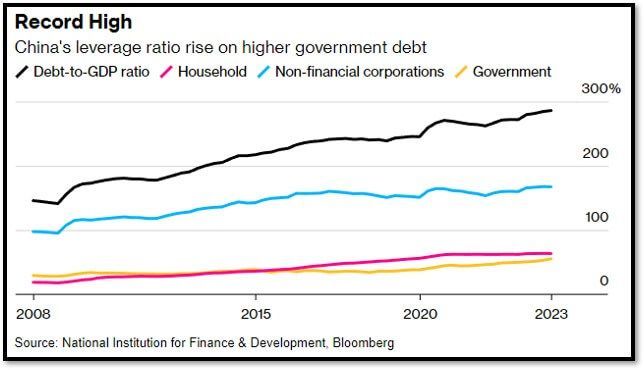
4b. Chinese Price Gauge Shows Longest Deflation Streak Since 1999 according to Bloomberg. China's economic growth is being hampered by low consumer confidence and a struggling housing market. The country's gross domestic product (GDP) deflator, a broad economic measure, decreased by 1.5% in the fourth quarter, continuing a trend of decline for the third consecutive quarter. This slump reflects weakened consumer spending and a downturn in the property sector. Despite efforts, China has faced challenges in boosting domestic demand and consumer confidence following an unsteady post-pandemic recovery. Key issues affecting the economy include persistent deflation, a significant downturn in the real estate market, and a complex regulatory environment. Meanwhile, China’s GDP grows 5.2% for the year 2023 – misses estimates, but hitting government target. Challenges remain with stubbornly high youth jobless rates, low birth rates, and a high “real” Debt-to-GDP ratio of 286.1%. Click onto picture below to access video. REF: Bloomberg1, Bloomberg2
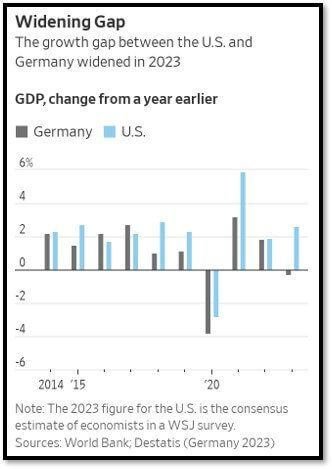
4c. Germany’s economy shrank last year, and new challenges point to more pain ahead according to The Wall Street Journal. Germany, Europe's largest economy and the fourth biggest globally, experienced a contraction of 0.3% in the last quarter of 2023, contributing to a six-year downward trend. This has led to concerns about deindustrialization and diminishing government support in the region. The German economy was only marginally larger in 2023 than in 2019, pre-pandemic, according to the German federal statistics agency. While other major Eurozone economies like France, Italy, and Spain reportedly grew last year, Germany faced a range of challenges. These include slower growth in key markets like China, rising energy prices and interest rates, global trade tensions, and the complex shift towards green energy. With these ongoing challenges, both cyclical and structural, Germany's economic outlook remains uncertain. REF: WSJ

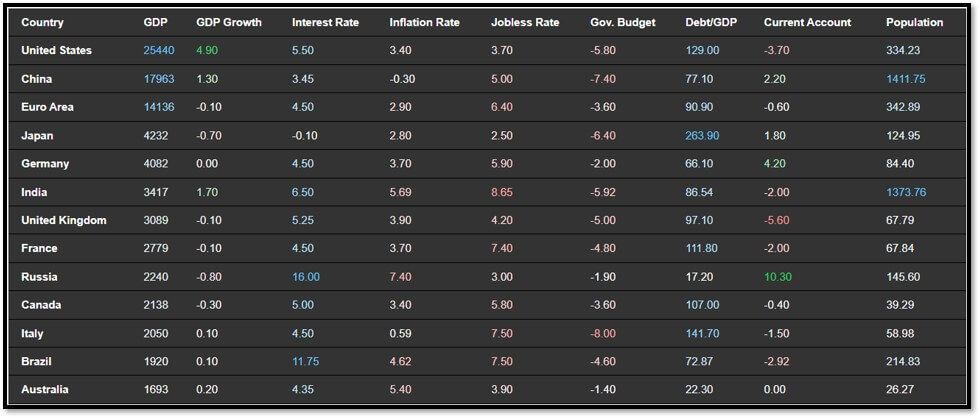
4d. Below is an updated snapshot of the current global state of economy according to TradingEconomics as of 1/16/2024. REF: TradingEconomics
- The annual inflation rate in the US went up to 3.4% in December 2023 from a five-month low of 3.1% in November, higher than market forecasts of 3.2%, as energy prices went down at a slower pace.
- China's consumer prices fell by 0.3% year-over-year in December 2023, marking the third straight month of decline which was the longest streak of drop since October 2009.
- The German economy contracted marginally by 0.1% in the third quarter of 2023, reversing the 0.1% growth seen in the previous three months.
- The annual inflation rate in India edged higher to 5.69% in December 2023 from 5.55% in November, below market forecasts of 5.87%.
5. Quant & Technical Corner – Below is a selection of quantitative & technical data we monitor on a regular basis to help gauge the overall financial markets and the investment environment.
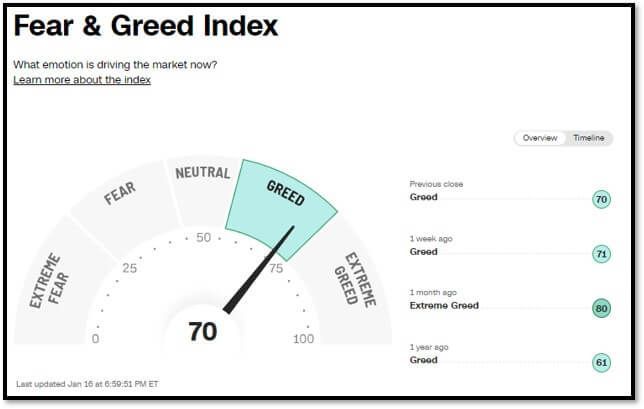
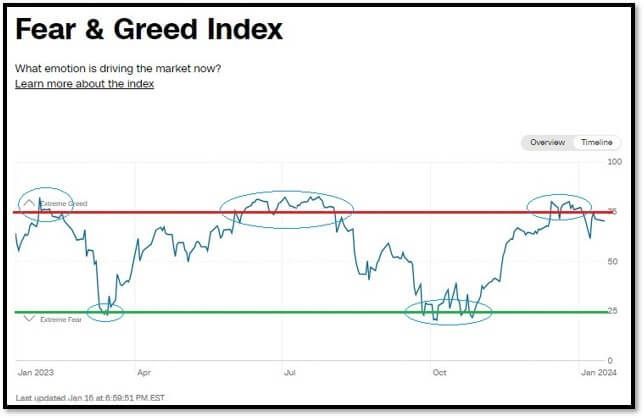
5a. Most recent read on the Fear & Greed Index with data as of 1/16/2024 – 6:59 PM-ET is 70 (Greed). Last week’s data was 71 (Greed) (1-100). CNNMoney’s Fear & Greed index looks at 7 indicators (Stock Price Momentum, Stock Price Strength, Stock Price Breadth, Put and Call Options, Junk Bond Demand, Market Volatility, and Safe Haven Demand). Keep in mind this is a contrarian indicator! REF: Fear&Greed via CNNMoney
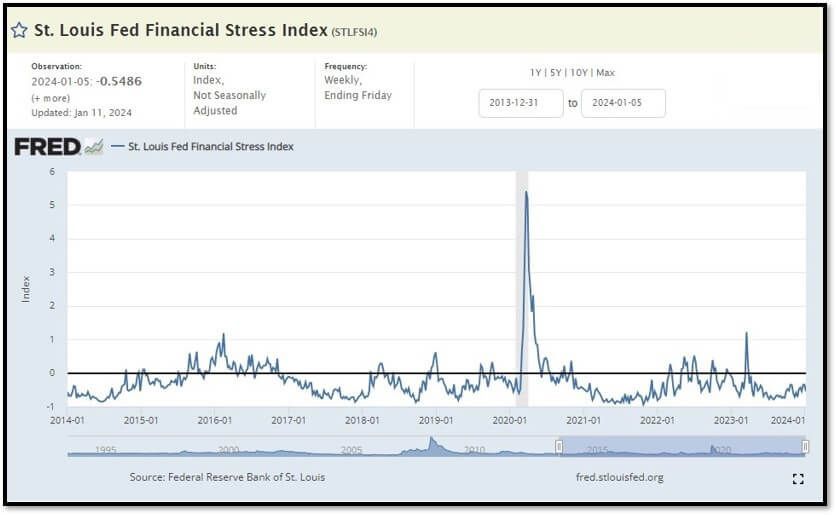
5b. St. Louis Fed Financial Stress Index’s (STLFSI4) most recent read is at -0.5486 as of January 11, 2024. A big spike up from previous readings reflecting the recent turmoil in the banking sector. Previous week’s data was -0.5546. This weekly index is not seasonally adjusted. The STLFSI4 measures the degree of financial stress in the markets and is constructed from 18 weekly data series: seven interest rate series, six yield spreads and five other indicators. Each of these variables captures some aspect of financial stress. Accordingly, as the level of financial stress in the economy changes, the data series are likely to move together. REF: St. Louis Fed
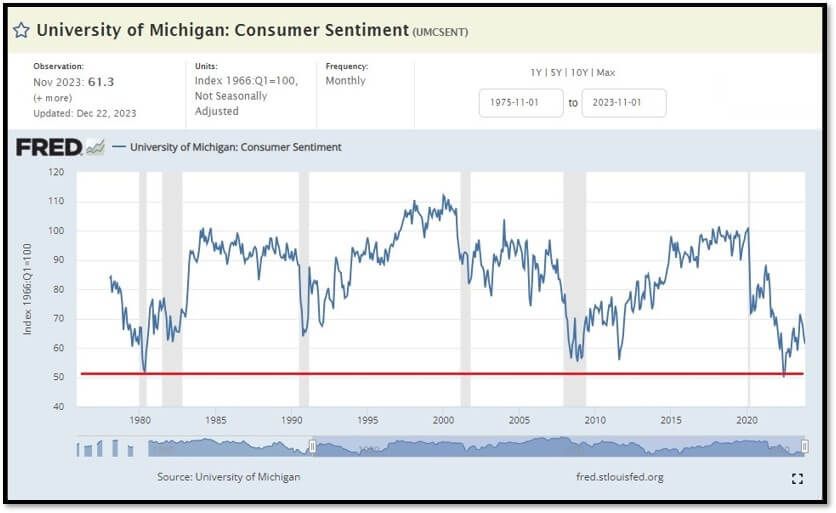
5c. University of Michigan, University of Michigan: Consumer Sentiment [UMCSENT] at 61.3 (last month’s data at 63.8), retrieved from FRED, Federal Reserve Bank of St. Louis, December 22, 2023. Back in June 2022, Consumer Sentiment hit a low point going back to April 1980. REF: UofM
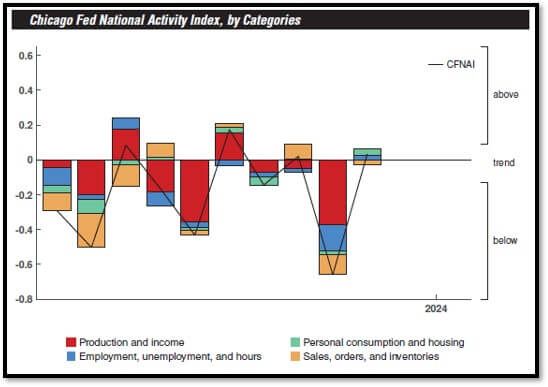
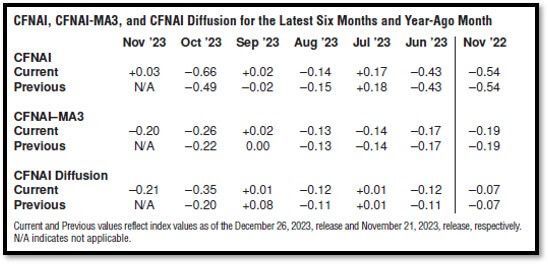
5d. The Chicago Fed National Activity Index (CFNAI) was +0.03 in November, up from –0.66 in October. Shading indicates official periods of recession as identified by the National Bureau of Economic Research. The CFNAI Diffusion Index represents the three-month moving average of the sum of the absolute values of the weights for the underlying indicators whose contribution to the CFNAI is positive in a given month less the sum of the absolute values of the weights for those indicators whose contribution is negative or neutral in a given month. Periods of economic expansion have historically been associated with values of the CFNAI Diffusion Index above –0.35. REF: ChicagoFed, November’s Report
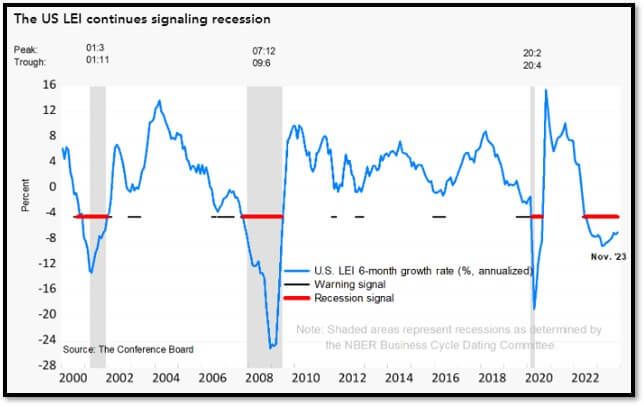
5e. (12/21/23) LEI for the U.S. declined by 0.5 percent in November 2023 to 103.0 (2016=100), following a (downwardly revised) decline of 1.0 percent in October. The LEI contracted by 3.5 percent over the six-month period between May and November 2023, a smaller decrease than its 4.3 percent contraction over the previous six months (November 2022 to May 2023). The composite economic indexes are the key elements in an analytic system designed to signal peaks and troughs in the business cycle. The indexes are constructed to summarize and reveal common turning points in the economy in a clearer and more convincing manner than any individual component. The CEI is highly correlated with real GDP. The LEI is a predictive variable that anticipates (or “leads”) turning points in the business cycle by around 7 months. Shaded areas denote recession periods or economic contractions. The dates above the shaded areas show the chronology of peaks and troughs in the business cycle. The ten components of The Conference Board Leading Economic Index® for the U.S. include: Average weekly hours in manufacturing; Average weekly initial claims for unemployment insurance; Manufacturers’ new orders for consumer goods and materials; ISM® Index of New Orders; Manufacturers’ new orders for nondefense capital goods excluding aircraft orders; Building permits for new private housing units; S&P 500® Index of Stock Prices; Leading Credit Index™; Interest rate spread (10-year Treasury bonds less federal funds rate); Average consumer expectations for business conditions. REF: ConferenceBoard, LEI Report for November (Released on 1/4/2024, Next Release 1/31/2024)
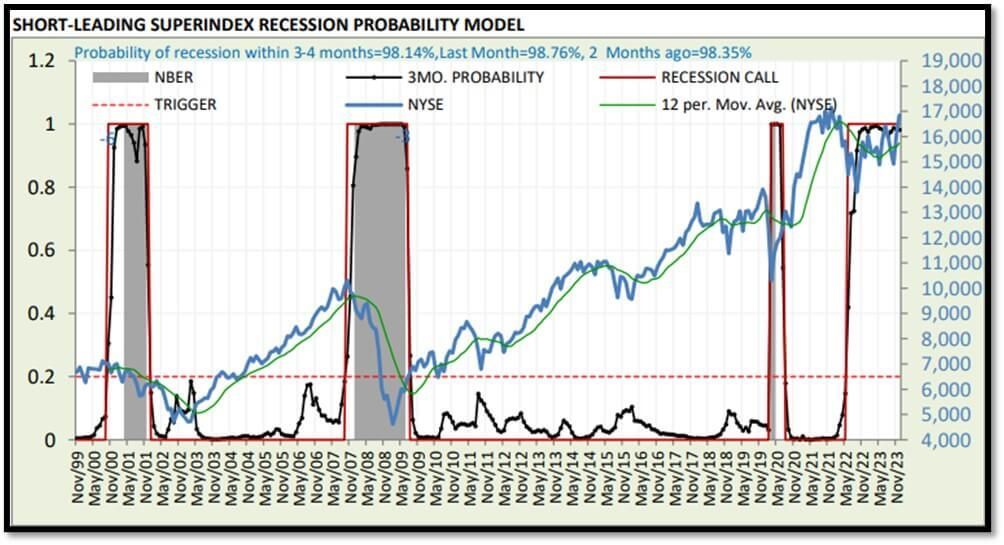
5f. Probability of U.S. falling into Recession within 3 to 4 months is currently at 98.14% (with data as of 01/07/2024 – Next Report 2024-01-22) according to RecessionAlert Research. Last release’s data was at 97.92%. This report is updated every two weeks. REF: RecessionAlertResearch
5g. Yield Curve as of 1/16/2024 is showing Inversion to Flattening. Spread on the 10-yr Treasury Yield (4.05%) minus yield on the 2-yr Treasury Yield (4.22%) is currently at -17 bps. REF: Stockcharts The yield curve—specifically, the spread between the interest rates on the ten-year Treasury note and the three-month Treasury bill—is a valuable forecasting tool. It is simple to use and significantly outperforms other financial and macroeconomic indicators in predicting recessions two to six quarters ahead. REF: NYFED
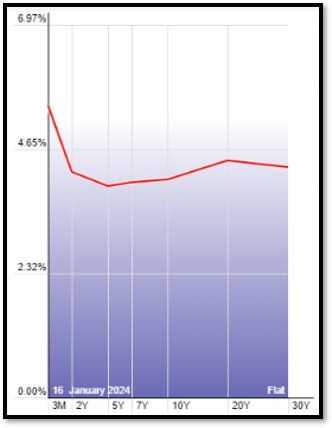
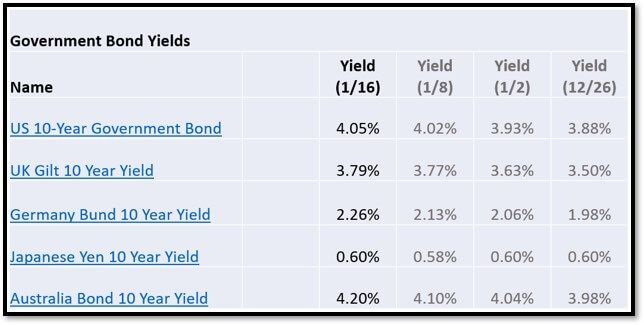
5h. Recent Yields in 10-Year Government Bonds. REF: Source is from Bloomberg.com, dated 1/16/2024, rates shown below are as of 1/16/2024, subject to change.
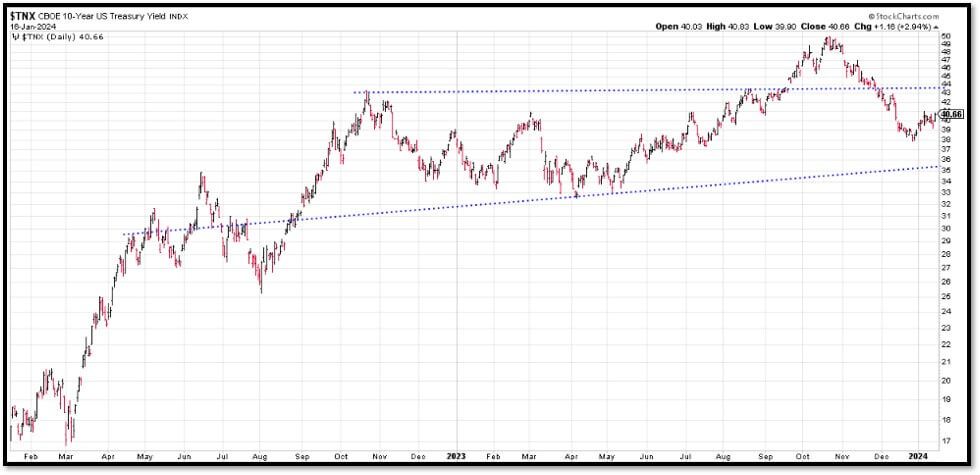
The 10-Year US Treasury Yield. Back at Trading Range… REF: StockCharts1, StockCharts2
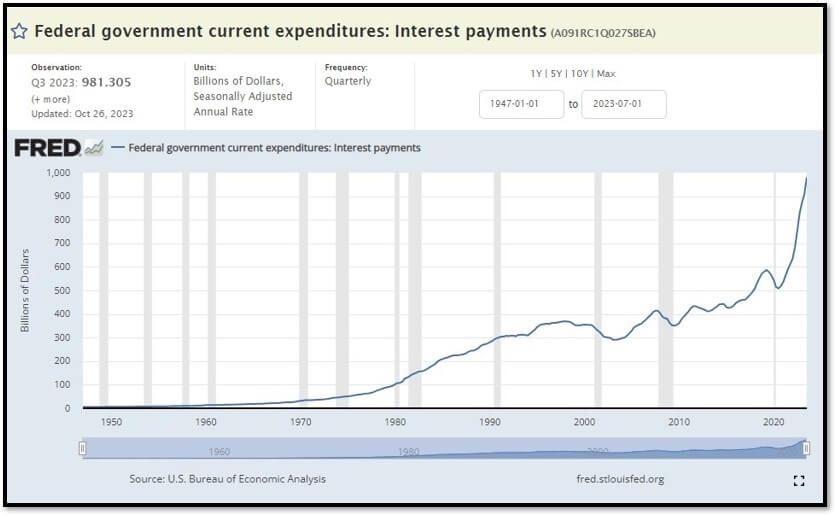
Federal government Interest Payments increased $71.721 B to $981.305 B as of Q3-23. REF: FRED-A091RC1Q027SBEA
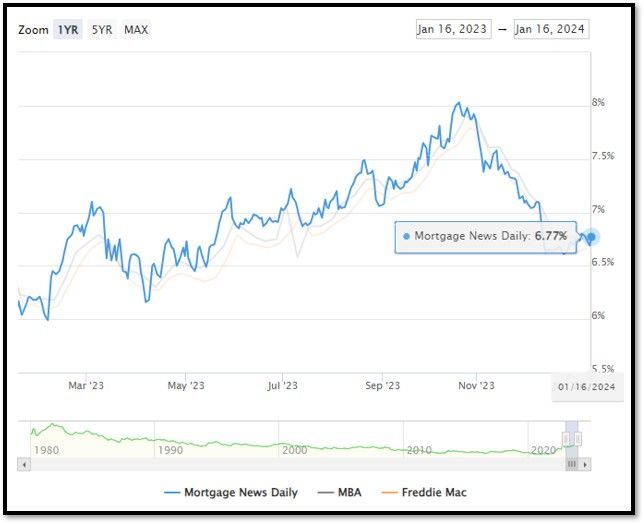
5i. (1/16/2024) Today’s National Average 30-Year Fixed Mortgage Rate is 6.77% (All Time High was 8.03% on 10/19/23). Last week’s data was 6.74%. This rate is the average 30-year fixed mortgage rates from several different surveys including Mortgage News Daily (daily index), Freddie Mac (weekly survey), Mortgage Bankers Association (weekly survey) and FHFA (monthly survey). REF: MortgageNewsDaily, Today’s Average Rate
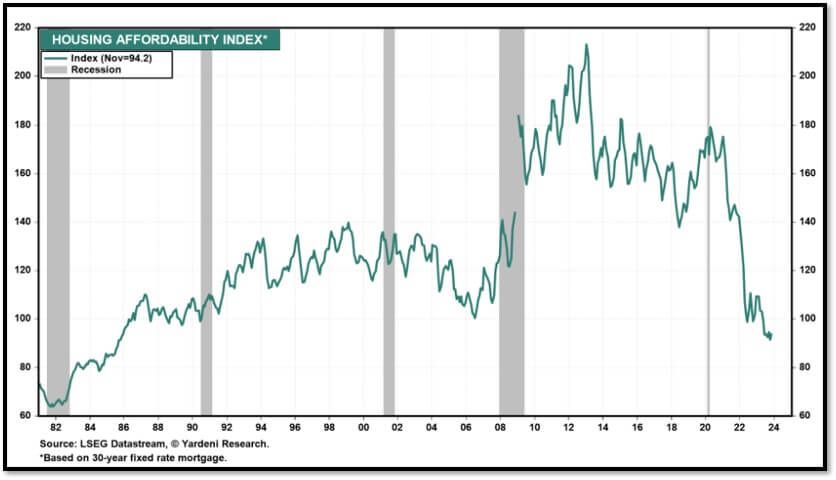
(1/16/24) Housing Affordability Index for November = 94.2 by Yardeni Research. REF: Yardeni
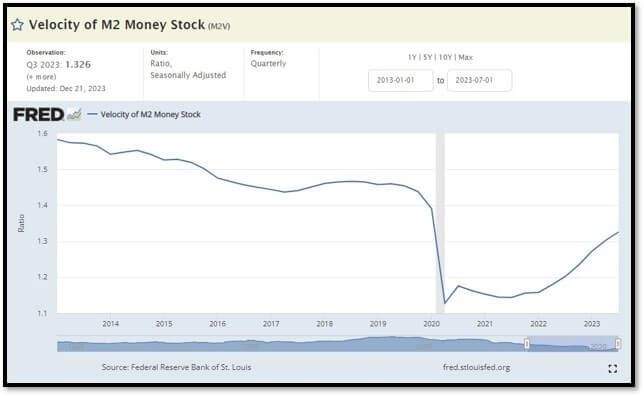
5j. Velocity of M2 Money Stock (M2V) with current read at 1.326 as of (Q3-2023 updated 12/21/2023). Previous quarter’s data was 1.302. The velocity of money is the frequency at which one unit of currency is used to purchase domestically- produced goods and services within a given time period. In other words, it is the number of times one dollar is spent to buy goods and services per unit of time. If the velocity of money is increasing, then more transactions are occurring between individuals in an economy. Current Money Stock (M2) report can be viewed in the reference link. REF: St.LouisFed-M2V
M2 has been sliding to the downside since April 2022 and recently just ticked up. M2 consists of M1 plus (1) small-denomination time deposits (time deposits in amounts of less than $100,000) less IRA and Keogh balances at depository institutions; and (2) balances in retail MMFs less IRA and Keogh balances at MMFs. Seasonally adjusted M2 is constructed by summing savings deposits (before May 2020), small-denomination time deposits, and retail MMFs, each seasonally adjusted separately, and adding this result to seasonally adjusted M1. Board of Governors of the Federal Reserve System (US), M2 [M2SL], retrieved from FRED, Federal Reserve Bank of St. Louis; Updated on December 26, 2023. REF: St.LouisFed-M2
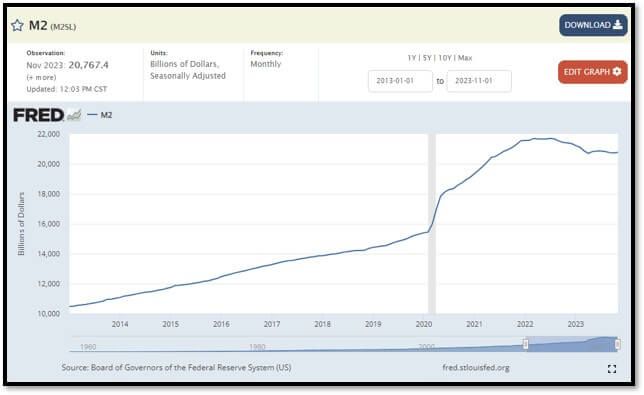
Money Supply M0 in the United States increased to 5,731,400 USD Million in November from 5,601,300 USD Million in October of 2023. REF: TradingEconomics, M0
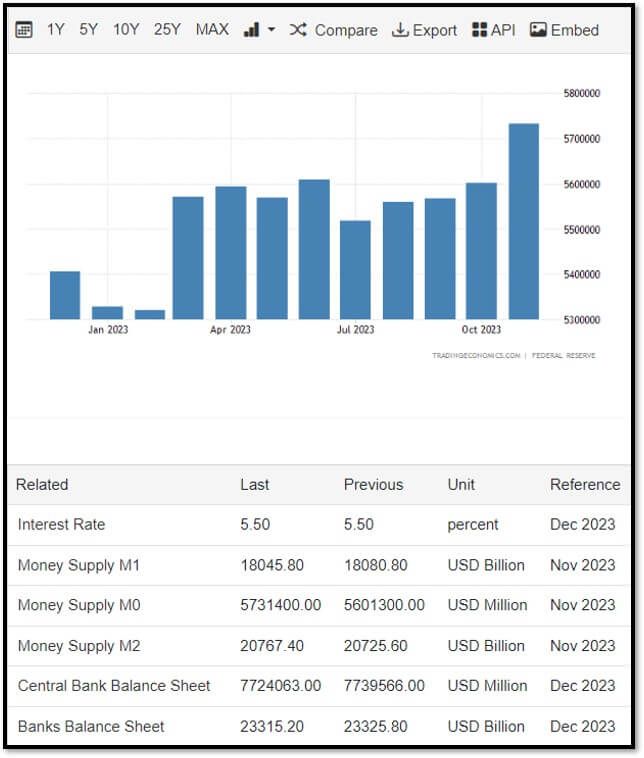
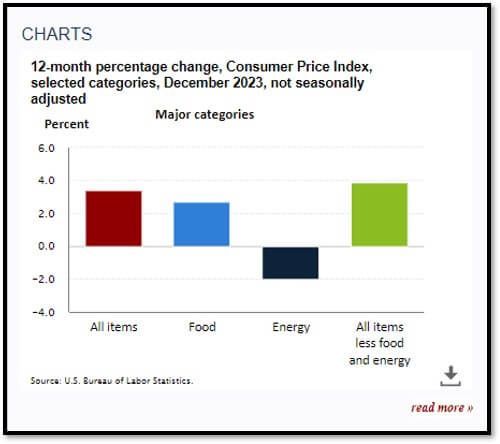
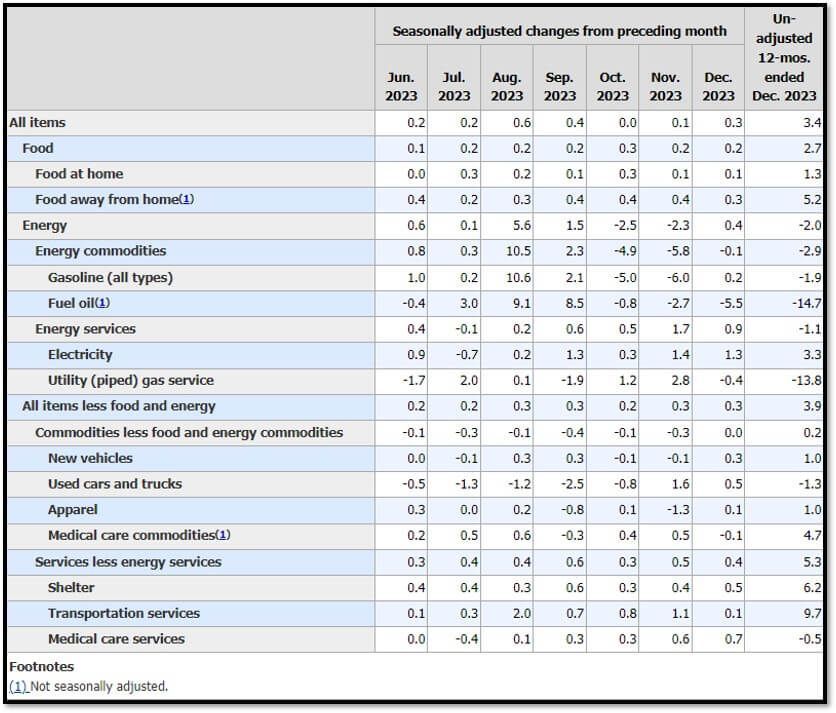
5k. In December, the Consumer Price Index for All Urban Consumers increased 0.3 percent, seasonally adjusted, and rose 3.4 percent over the last 12 months, not seasonally adjusted. The index for all items less food and energy increased 0.3 percent in December (SA); up 3.9 percent over the year (NSA). January 2024 CPI data are scheduled to be released on February 13, 2024, at 8:30AM-ET. REF: BLS, BLS.GOV
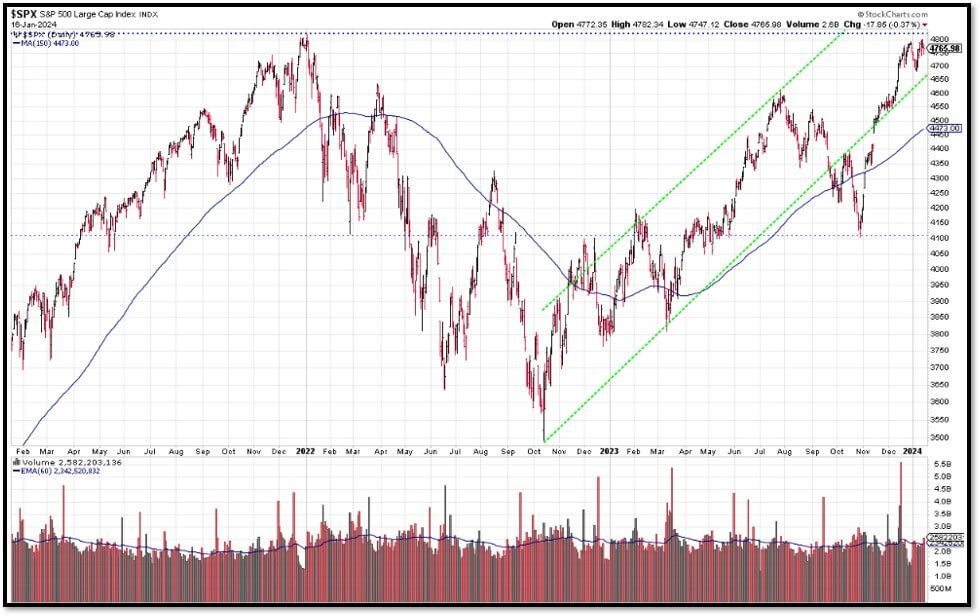
5l. Technical Analysis of the S&P500 Index. Click onto reference links below for images.
- Short-term Chart: Meeting Resistance – Bullish on 1/16/2024 – REF: Short-term S&P500 Chart by Marc Slavin (Click Here to Access Chart)
- Medium-term Chart: Meeting Resistance – Bullish on 1/16/2024 – REF: Medium-term S&P500 Chart by Marc Slavin (Click Here to Access Chart)
- Market Timing Indicators – S&P500 Index as of 1/16/2024 – REF: S&P500 Charts (7 of them) by Joanne Klein’s Top 7 (Click Here to Access Charts)
- A well-defined uptrend channel shown in green with S&P500 broke support to the downside and recovered. REF: Stockcharts
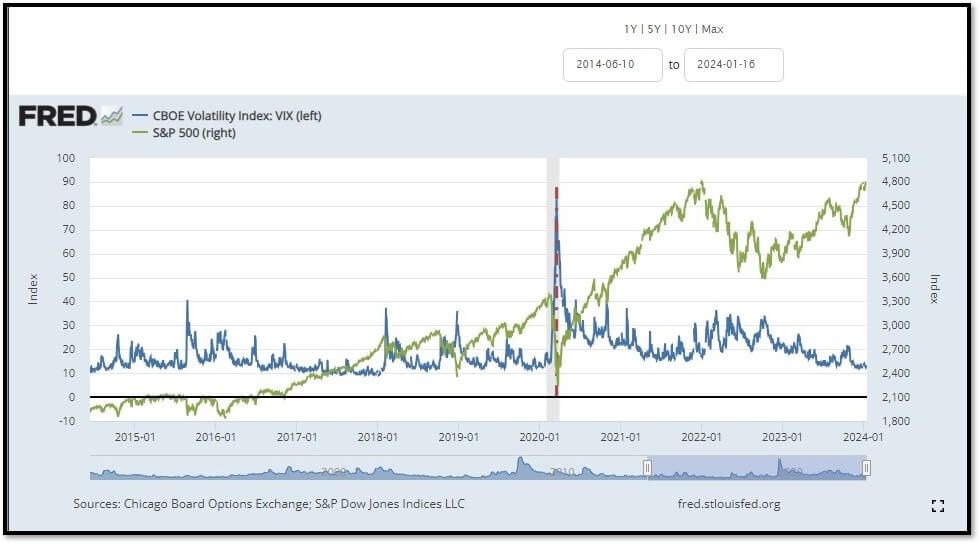
- S&P500 and CBOE Volatility Index (VIX) as of 1/16/2024. REF: FRED, Today’s Print
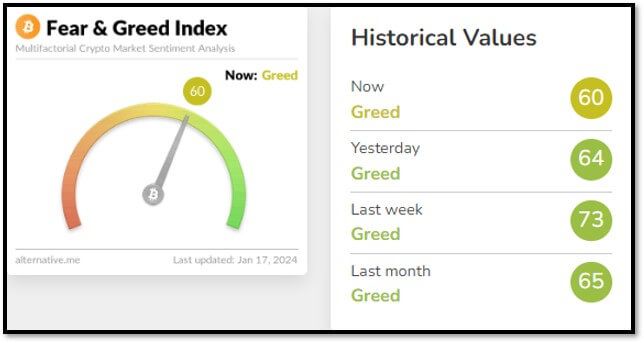
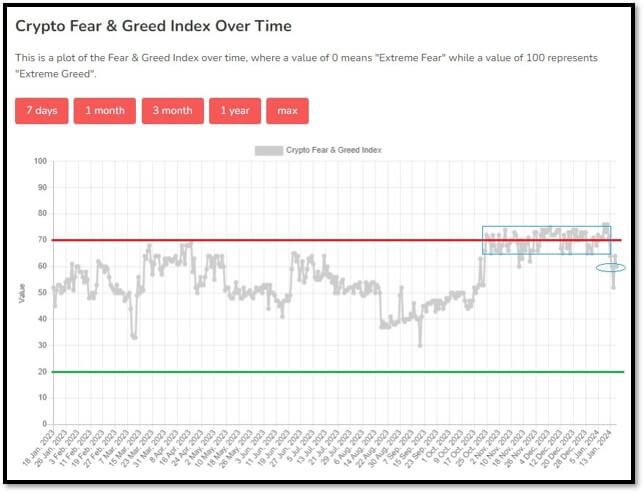
5m. Most recent read on the Crypto Fear & Greed Index with data as of 1/17/2024au is 60 (Greed). Last week’s data was 73 (Greed) (1-100). Fear & Greed Index – A Contrarian Data. The crypto market behavior is very emotional. People tend to get greedy when the market is rising which results in FOMO (Fear of missing out). Also, people often sell their coins in irrational reaction of seeing red numbers. With the Crypto Fear and Greed Index, the data try to help save investors from their own emotional overreactions. There are two simple assumptions:
- Extreme fear can be a sign that investors are too worried. That could be a buying opportunity.
- When Investors are getting too greedy, that means the market is due for a correction.
Therefore, the program for this index analyzes the current sentiment of the Bitcoin market and crunch the numbers into a simple meter from 0 to 100. Zero means "Extreme Fear", while 100 means "Extreme Greed". REF: Alternative.me, Today’sReading
Bitcoin currently still in a bearish to bullish formation trading above the 150-day moving average. REF: Stockcharts
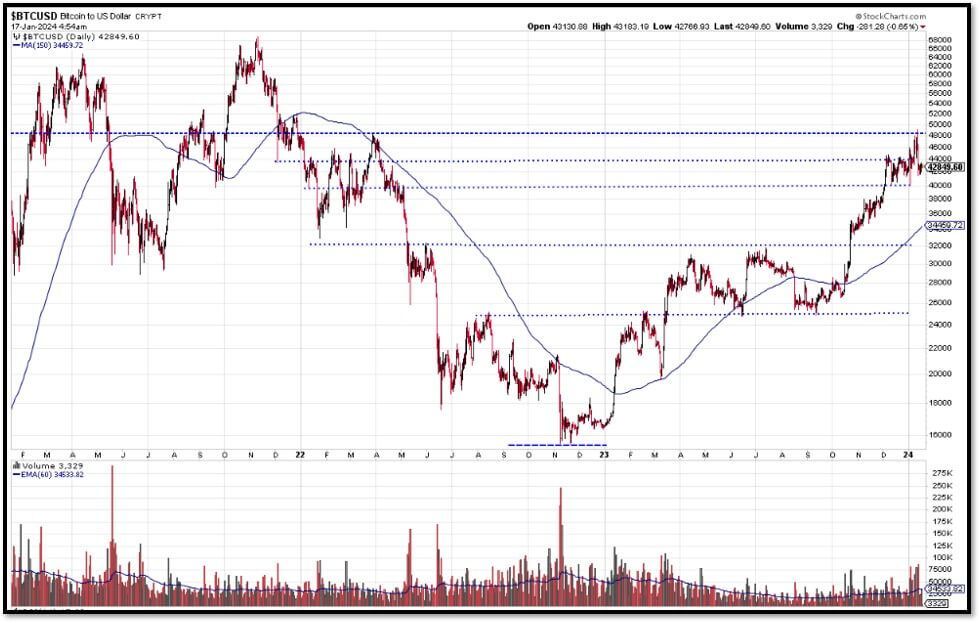
On Wednesday (1/10/24) evening, the Securities and Exchange Commission (SEC) finally sanctioned a range of spot bitcoin ETFs, a decision long awaited by the market. Following the announcement of the ETF launch, Bitcoin experienced a surge, reaching $49,000 on Thursday morning, but later saw a reduction in its gains. The debut trading day for many of the newly introduced bitcoin ETFs observed a downturn. In this initial approval phase, the SEC authorized 11 applicants for bitcoin exchange-traded funds. Notable among the approved ETFs are those from ARK Invest (ARKK), BlackRock (BLK), VanEck, WisdomTree, Fidelity, Invesco, Franklin, Hashdex, and Valkyrie. Additionally, Grayscale was granted permission to elevate GBTC to the New York Stock Exchange, as reported by Investors Business Daily (IBD). The issuers revealed their fee structures for the ETFs, ranging from 0.2% to 1.5% (excluding waivers), in their recent regulatory updates on January 9 and 10. REF: IBD

FOR INFORMATIONAL AND EDUCATIONAL USE ONLY